Hey friends,
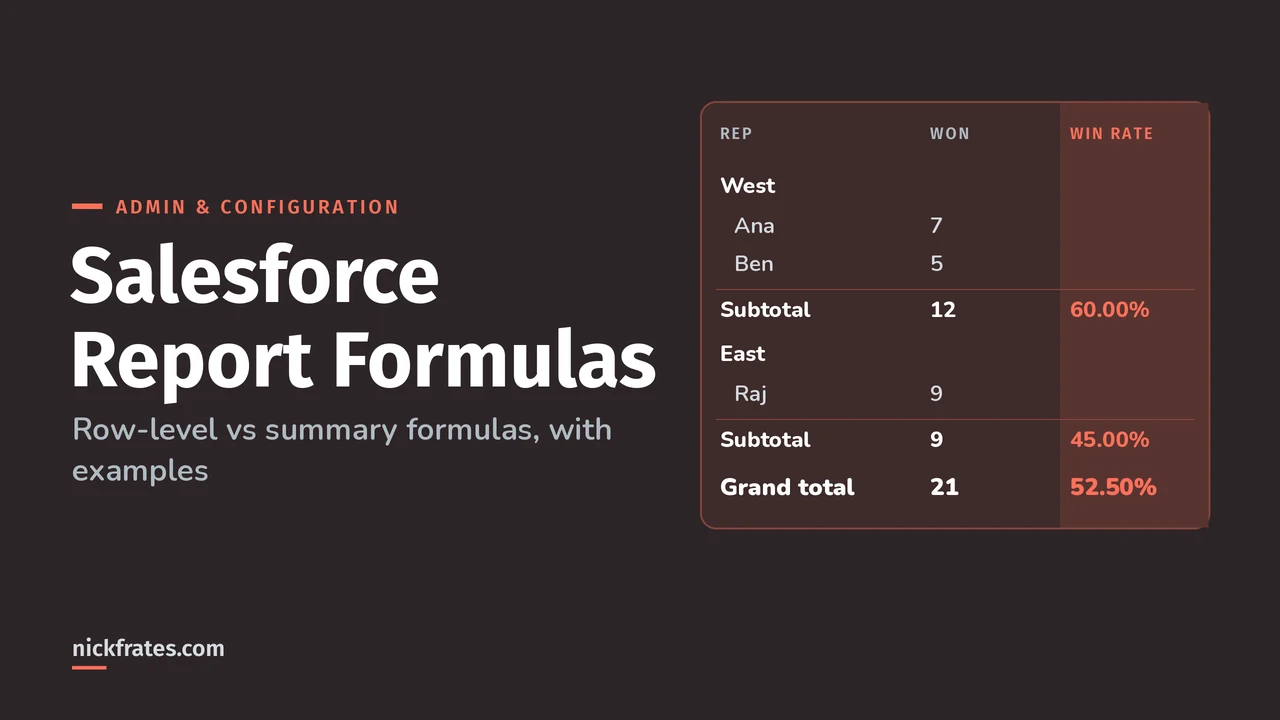
Salesforce reports have two kinds of formulas. A row-level formula calculates a value for each record and shows it as a column, like days to close for each opportunity. A summary formula calculates from grouped totals, like win rate per rep, and needs at least one grouping. Both are added from the Columns section of the Outline panel in the report builder.
I'm drawing on Salesforce Help's row-level formula limits page, the functions reference and two Trailhead projects: Evaluate Each Record with Row-Level Formulas and Use Summary Formulas in Your Reports.
Row-level vs summary at a glance
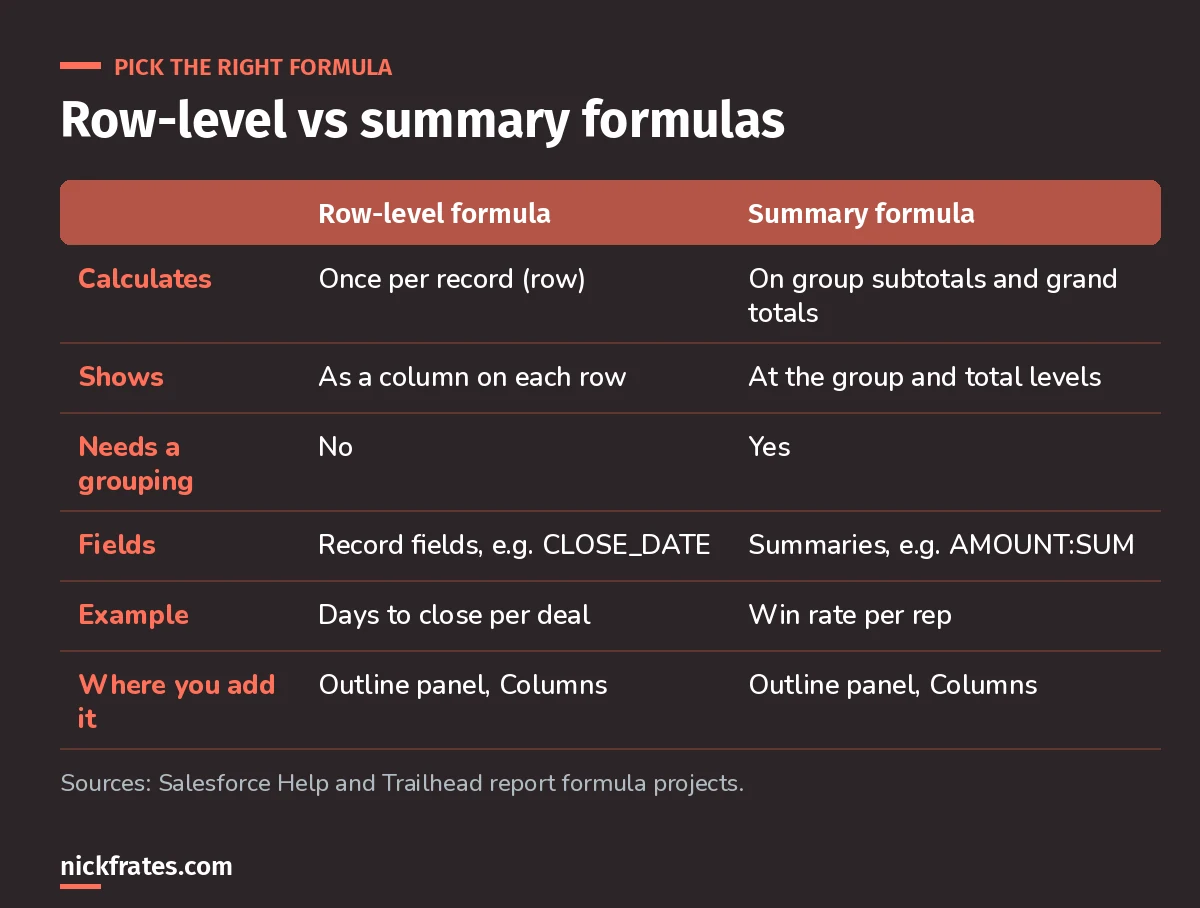
Ask: is the answer about one record, or about a group?
Row-level formula example: days to close
The Trailhead project builds this on a closed opportunities report:
- In the Outline panel, find Columns, open the menu and choose Add Row-Level Formula.
- Name the column Time to Close, set the output type to Number and decimal places to 0.
- Enter the formula below, click Validate, then Apply.
Two details worth noticing. Report formulas use API-style names like CLOSE_DATE; the easy way to get them right is to search the field in the formula editor and click Insert. And Created Date is a date/time, so DATEVALUE converts it before subtracting, the same rule as in formula fields.
The output type is Number even though it uses dates, because subtracting two dates returns a number of days.
Summary formula example: win rate by rep
Summary formulas work on summarized values. The Trailhead project groups closed opportunities by owner and adds:
WON:SUM is the number of won deals in the group and CLOSED:SUM the number closed, so the result is that rep's win rate. Turn off Detail Rows to see just the summary. The same project notes you can add up to five summary formulas to summary and matrix reports.
I wrote a full walkthrough of calculating opportunity win rate if you want the variations.
Cert Lab by Nick Frates
Reports are on the App Builder exam too
The App Builder Cert Lab covers formulas, report types and data modeling with practice questions that explain every option.
Start the App Builder Cert Lab, $9.99 →Comparing groups: PARENTGROUPVAL and PREVGROUPVAL
Two summary functions let a group look outside itself. From the functions reference:
- PARENTGROUPVAL returns the value of a parent grouping, any level above the one containing the formula. Use it for percent of total.
- PREVGROUPVAL returns the value of a previous grouping. You choose the level and the increment (how many rows or columns back): the default is 1 and the maximum is 12. Use it for month-over-month change.
Both work only in custom summary formulas, at grouping levels, not summary levels. I insert them from the formula editor rather than typing them, so the grouping names come out right.
Row-level formula limits
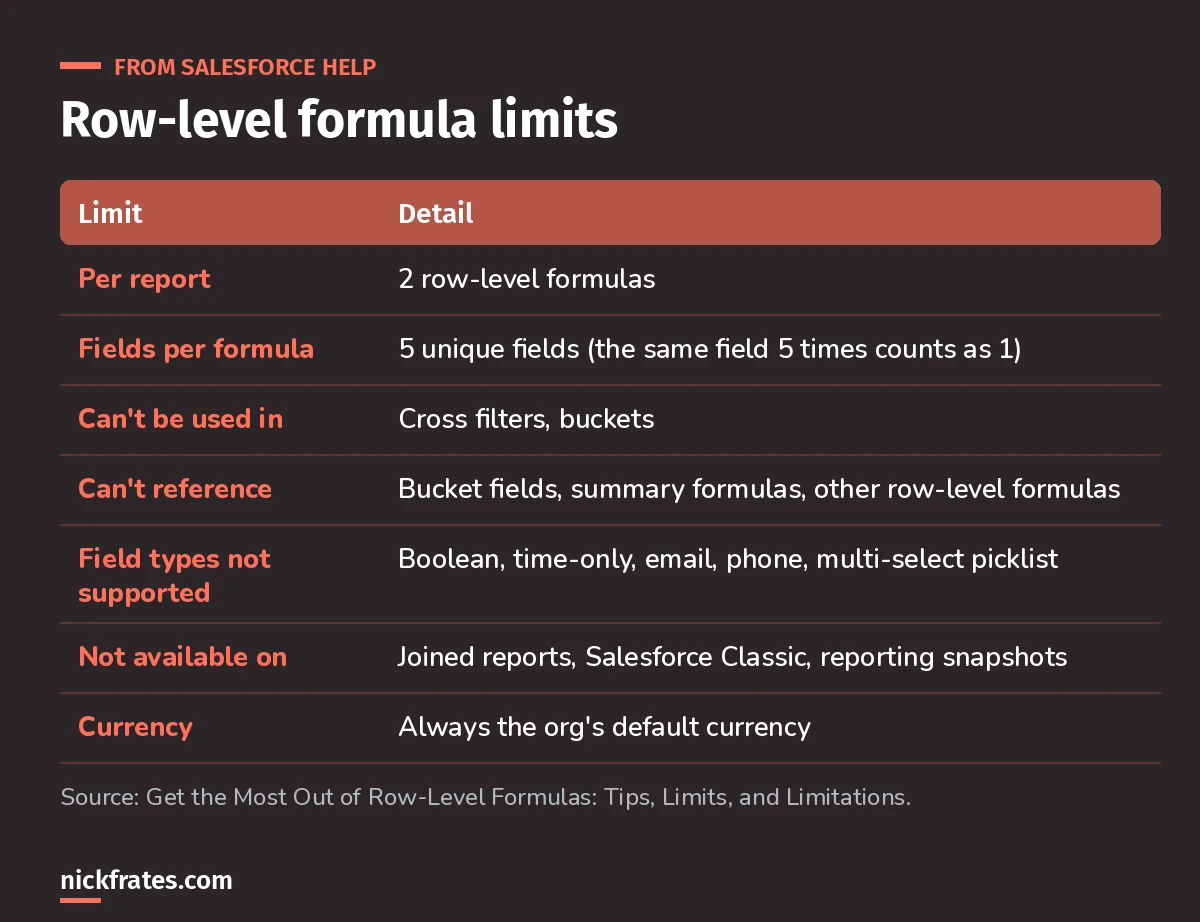
The 5-field and 2-formula limits are the ones you'll hit first.
Two more from that page: "with or without" custom report types (like Accounts with or without Contacts) don't support row-level formulas at all, and the button simply doesn't appear. And row-level formulas always use the org's default currency, even if the report is set to show another.
Report formula or formula field?
If the calculation only matters in one report, a row-level formula keeps your object clean. If people need it on the record page, in list views, in other reports or in automation, make it a formula field. And if you're over the 5-field limit, that's a sign it belongs on the object.
Keep going
- Salesforce reports and dashboards: report types, filters and charts.
- Salesforce formula examples: the same functions in formula fields.
- Dynamic report filters: one report, many audiences.
Cert Lab by Nick Frates
Get the Platform App Builder Cert Lab
Lessons, practice questions and flashcards for all 5 App Builder exam sections, built from the official exam guide.
Start the App Builder Cert Lab, $9.99 →Hope this helps!
Best,
Nick